Overview
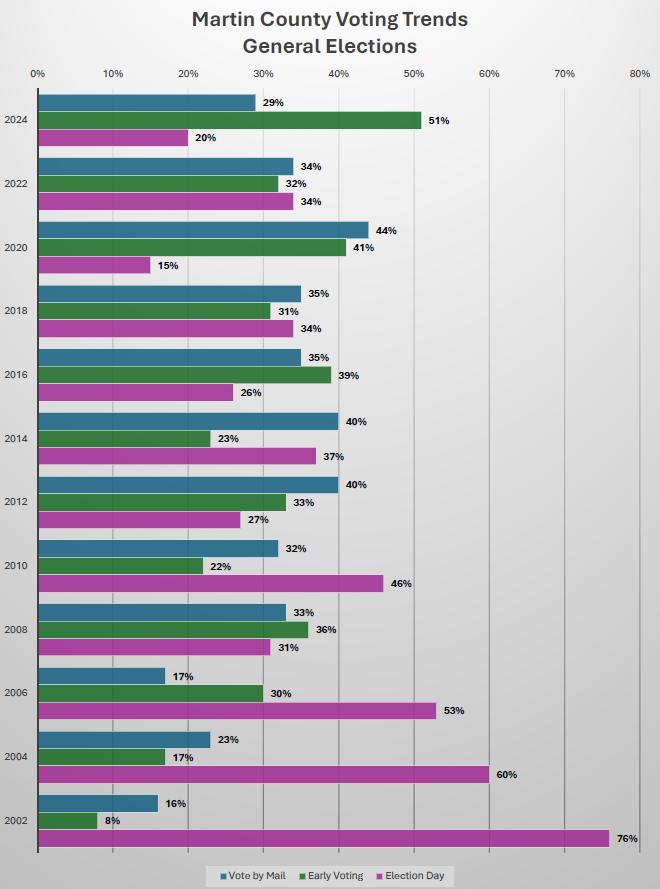
The chart shows the Martin County voting trends of the General Elections for the even years of 2002 thru 2024. It shows that the percentage of voters that voted at the precinct have decreased over the years, while the percentage of voters that early voted or voted by mail have increased over the years.
Values
Numerical values presented on the image:
| Year | Voted at Precinct | Voted Early | Voted by Mail |
|---|---|---|---|
| 2002 | 76% | 8% | 16% |
| 2004 | 60% | 17% | 23% |
| 2006 | 53% | 30% | 17% |
| 2008 | 31% | 36% | 33% |
| 2010 | 46% | 22% | 32% |
| 2012 | 27% | 33% | 40% |
| 2014 | 37% | 23% | 40% |
| 2016 | 26% | 39% | 35% |
| 2018 | 34% | 31% | 35% |
| 2020 | 15% | 41% | 44% |
| 2022 | 34% | 32% | 34% |
| 2024 | 20% | 51% | 29% |
Presentation
The bar chart represents the percentage of votes per year, by vote type, for General Elections. Percentage of voters for each year and vote type are represented using columns lined up horizontally, with heights indicating the percentage of voters.

Overview
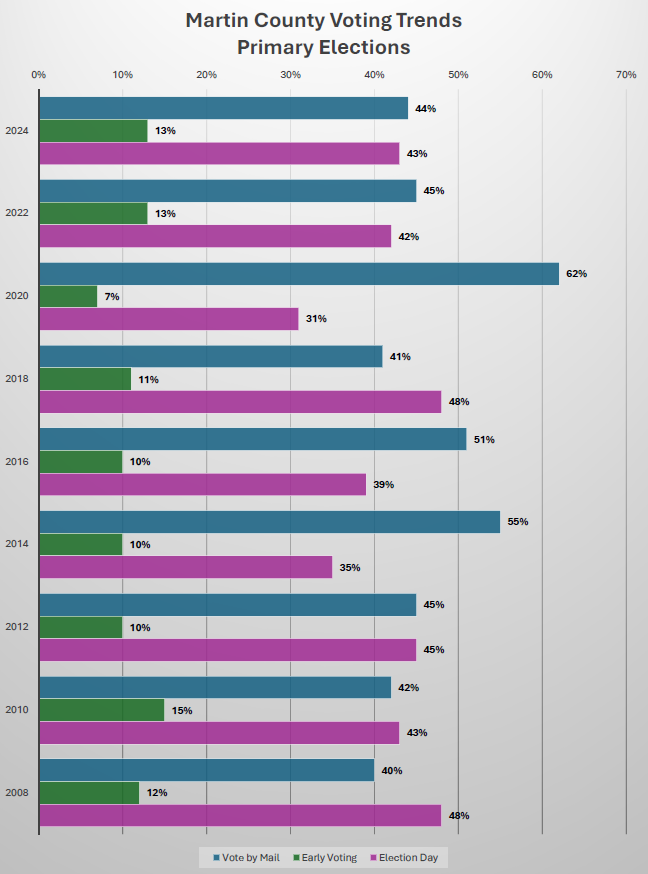
The chart shows the Martin County voting trends for the Primary Elections for the even years of 2008 thru 2024. It shows that the percentage of voters that voted on Election Day has decreased slightly over the years. It shows the Early Votes have stayed about the same percentage over the years, while the percentage of voters that voted by mail have increased with peaks in 2014 and 2020.
Values
Numerical values presented on the image:
| Year | Voted at Precinct | Voted Early | Voted by Mail |
|---|---|---|---|
| 2008 | 48% | 12% | 40% |
| 2010 | 43% | 15% | 42% |
| 2012 | 45% | 10% | 45% |
| 2014 | 35% | 10% | 55% |
| 2016 | 39% | 10% | 51% |
| 2018 | 48% | 11% | 41% |
| 2020 | 31% | 7% | 62% |
| 2022 | 42% | 13% | 45% |
| 2024 | 43% | 13% | 44% |
Presentation
The bar chart represents the percentage of votes per year, by vote type, for Primary Elections. Percentage of voters for each year and vote type are represented using columns lined up horizontally, with heights indicating the percentage of voters.


